JPMorgan Large Cap Growth R6 Review: JLGMX Performance, Holdings, Fees, and Risks
JPMorgan Large Cap Growth R6, ticker JLGMX, is an actively managed mutual fund focused on large, established companies with above-average growth potential. It has delivered strong long-term results, but its portfolio also carries meaningful concentration in technology and a relatively small group of major growth stocks.
If JLGMX appears in your 401(k) or another investment account, the numbers that matter most are its holdings, performance, fees, strategy, and how much additional growth-stock exposure it adds to your portfolio.
What Is JPMorgan Large Cap Growth R6?
JPMorgan Large Cap Growth Fund Class R6 is managed by J.P. Morgan Investment Management. Its objective is long-term capital appreciation, and the R6 share class trades under the ticker JLGMX.
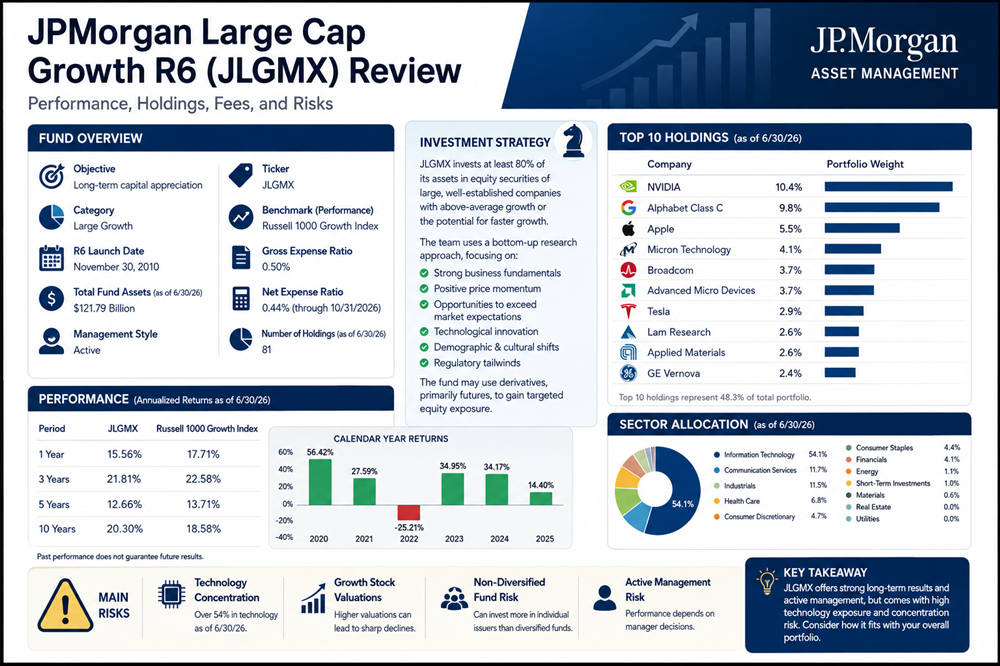
The R6 class launched on November 30, 2010. As of June 30, 2026, the overall JPMorgan Large Cap Growth Fund had approximately $121.79 billion in assets. That figure represents the total fund, not just money invested through R6 shares.
| Fund Detail | JLGMX |
|---|---|
| Full Name | JPMorgan Large Cap Growth Fund Class R6 |
| Ticker | JLGMX |
| Category | Large Growth |
| Objective | Long-term capital appreciation |
| R6 Launch Date | November 30, 2010 |
| Total Fund Assets | $121.79 billion |
| Gross Expense Ratio | 0.50% |
| Current Net Expense Ratio | 0.44% |
| Performance Benchmark | Russell 1000 Growth Index |
| Approximate Holdings | 81 |
| Management Style | Active |
The Russell 1000 Growth Index is the fund’s performance benchmark in J.P. Morgan’s fact sheet. Its formal regulatory benchmark is the broader Russell 1000 Index.
How JPMorgan Large Cap Growth R6 Invests
JLGMX does not simply copy an index. Its managers select individual companies they believe have attractive fundamentals and growth prospects that may not yet be fully reflected in their stock prices.
Under normal conditions, at least 80% of fund assets are invested in equity securities of large, well-established companies. J.P. Morgan generally looks for companies with a record of above-average growth or businesses expected to enter a period of faster growth.
The investment team uses a bottom-up research process. Instead of building the portfolio mainly around forecasts for the overall economy, managers examine individual companies and look for qualities such as:
- Strong business fundamentals
- Positive price momentum
- Opportunities to exceed market expectations
- Technological changes creating new markets
- Demographic or cultural shifts
- Regulatory developments that may support growth
A holding can be sold when the original investment case weakens, expectations become too high, a company’s balance sheet deteriorates, or another opportunity looks more attractive.
The fund can also use derivatives, primarily futures contracts, to gain targeted equity exposure from cash positions. Its latest prospectus reports a 52% portfolio turnover rate for the most recent fiscal year. Higher turnover can create additional trading costs and, in taxable accounts, potentially affect taxes.
JPMorgan Large Cap Growth R6 Holdings
JLGMX owned approximately 81 holdings as of June 30, 2026, but a significant portion of the portfolio was concentrated in its largest positions.
Top JLGMX Holdings
| Company | Portfolio Weight |
|---|---|
| NVIDIA | 10.4% |
| Alphabet Class C | 9.8% |
| Apple | 5.5% |
| Micron Technology | 4.1% |
| Broadcom | 3.7% |
| Advanced Micro Devices | 3.7% |
| Tesla | 2.9% |
| Lam Research | 2.6% |
| Applied Materials | 2.6% |
| GE Vernova | 2.4% |
These figures were reported in the J.P. Morgan Large Cap Growth Fund fact sheet as of June 30, 2026 and can change as the managers adjust the portfolio.
NVIDIA and Alphabet alone represented about 20% of the portfolio, making their performance particularly influential.
Semiconductor companies are also prominent. NVIDIA, Micron, Broadcom, AMD, Lam Research, and Applied Materials all ranked among the fund’s ten largest holdings. That gives JLGMX substantial exposure to semiconductor demand, data centers, artificial intelligence infrastructure, and related technology spending.
JLGMX Sector Exposure
Technology dominates the portfolio.
As of June 30, 2026, information technology accounted for 54.1% of the fund’s sector allocation.
| Sector | Weight |
|---|---|
| Information Technology | 54.1% |
| Communication Services | 11.7% |
| Industrials | 11.5% |
| Health Care | 6.8% |
| Consumer Discretionary | 4.7% |
| Consumer Staples | 4.4% |
| Financials | 4.1% |
| Energy | 1.1% |
| Short-Term Investments | 1.0% |
| Materials | 0.6% |
| Real Estate | 0.0% |
| Utilities | 0.0% |
The technology weighting is important when deciding whether JLGMX fits your portfolio. If you already hold an S&P 500 fund, Nasdaq-focused fund, or another growth fund, you may already own many of the same technology companies.
Owning several funds does not necessarily mean your portfolio is well diversified if those funds hold many of the same stocks.
JPMorgan Large Cap Growth R6 Performance
JLGMX has produced strong long-term results, although it has not beaten its growth benchmark over every period.
J.P. Morgan reported the following annualized returns through June 30, 2026:
| Period | JLGMX | Russell 1000 Growth Index |
|---|---|---|
| 1 Year | 15.56% | 17.71% |
| 3 Years | 21.81% | 22.58% |
| 5 Years | 12.66% | 13.71% |
| 10 Years | 20.30% | 18.58% |
JLGMX trailed the Russell 1000 Growth Index over the one-, three-, and five-year periods shown above. Over ten years, however, JLGMX’s 20.30% annualized return exceeded the benchmark’s 18.58%.
That difference highlights both sides of active management. Skilled stock selection can lead to long-term outperformance, but there will also be periods when the managers’ choices lag a passive benchmark.
The fund’s individual calendar years also show how quickly results can change. JLGMX gained 56.42% in 2020, lost 25.21% in 2022, gained 34.95% in 2023, and rose another 34.17% in 2024. Its 2025 return was 14.40%.
Those swings are a useful reminder that a large-cap growth fund can still experience substantial declines.
Past performance does not guarantee future results.
JPMorgan Large Cap Growth R6 Fees
JLGMX’s R6 share class has relatively straightforward expenses.
The current figures are:
- Gross expense ratio: 0.50%
- Net expense ratio: 0.44%
- 12b-1 distribution fee: None
- Service fee: None
The 0.44% net expense ratio reflects contractual fee waivers and reimbursements that remain in effect through October 31, 2026.
At a 0.44% expense ratio, $10,000 invested in the fund would represent about $44 per year in fund-level expenses if the account value remained unchanged. The actual dollar cost varies with the value of your investment.
Even relatively small differences in mutual fund fees and expenses can become meaningful over long holding periods because investment costs reduce the amount of money that remains invested.
The fund’s prospectus provides a standardized cost example estimating $45 in expenses during the first year on a hypothetical $10,000 R6 investment, based on its required assumptions.
Who Can Invest in JLGMX R6 Shares?
The published minimum investment can make JLGMX look inaccessible to individual investors, but R6 eligibility is more complicated than the headline number suggests.
For investors establishing certain direct R6 accounts, the prospectus lists the following minimums:
- $5 million for discretionary accounts
- $5 million for institutional investors
- $15 million for other investors
However, there is no investment minimum for certain other eligible R6 investors. Shares can also be available through eligible retirement plans and financial intermediaries.
That is why an employee can sometimes select JLGMX inside a 401(k) without personally investing millions of dollars.
Main Risks of JLGMX
JLGMX’s long-term returns come with risks that are worth understanding before focusing on its performance numbers.
Technology Concentration
More than half of the portfolio was allocated to information technology as of June 30, 2026. Technology stocks can be sensitive to changes in product cycles, competition, regulation, growth expectations, and rapidly evolving technology.
A downturn affecting major technology and semiconductor companies could therefore have an outsized impact on JLGMX.
Growth Stock Valuations
Growth companies often trade at higher earnings multiples because investors expect profits to increase quickly.
When a company misses those expectations—or investors become less willing to pay high valuations—its share price can fall sharply.
Non-Diversified Fund Risk
JLGMX is legally classified as a non-diversified fund.
That classification allows it to invest a greater percentage of its assets in individual issuers than a diversified fund may. Larger positions can help when those companies perform well, but they can also make losses in individual holdings more noticeable.
Active Management Risk
JLGMX depends on the investment team’s judgment.
If managers overestimate a company’s growth prospects, pay too high a valuation, or miss stronger opportunities elsewhere, the fund can underperform its benchmark.
The recent performance numbers show that active management does not guarantee outperformance: JLGMX trailed the Russell 1000 Growth Index over the one-, three-, and five-year periods ending June 30, 2026.
JLGMX vs. a Large-Cap Growth Index Fund
The main difference between JLGMX and a typical large-cap growth index fund is who decides what goes into the portfolio.
An index fund follows rules established by its underlying index. JLGMX’s managers actively decide which stocks to own and how large each position should be. FINRA’s overview of active versus passive investing explains this basic difference and the trade-offs involved.
JLGMX offers:
- Professional active stock selection
- The ability to overweight companies managers find attractive
- Potential to outperform its benchmark
- A current net expense ratio of 0.44%
A passive growth index fund generally offers:
- Rules-based portfolio construction
- Lower manager-selection risk
- Often lower expenses
- Performance designed to closely follow its chosen index before fees
Neither approach automatically produces better future returns.
JLGMX beat the Russell 1000 Growth Index over the ten-year period ending June 30, 2026, but trailed it over several shorter periods.
Who Might Consider JPMorgan Large Cap Growth R6?
JLGMX may be worth considering if you have access through a retirement plan or another eligible account and want actively managed large-cap growth exposure.
It is more likely to fit investors who:
- Have a long time horizon
- Can tolerate stock-market volatility
- Want active management
- Are comfortable with heavy technology exposure
- Do not already have excessive overlap with similar growth funds
The overlap question deserves particular attention. A portfolio containing JLGMX alongside several technology-heavy index or growth funds may be much more concentrated than it first appears.
Is JPMorgan Large Cap Growth R6 a Good Investment?
JLGMX has a strong long-term record, relatively low expenses for an actively managed institutional share class, and exposure to many leading growth companies. Its 10-year annualized return of 20.30% through June 30, 2026 was ahead of the Russell 1000 Growth Index’s 18.58%.
The trade-off is concentration. Technology represented more than half of the portfolio, and several individual companies carried large weights. Investors also accept the possibility that active stock selection will trail the benchmark during some periods.
For someone who wants an actively managed growth allocation and can tolerate those risks, JLGMX is a credible option to evaluate. Whether it belongs in your portfolio depends less on its past return and more on how its holdings, technology exposure, fees, and volatility fit alongside everything else you own.
Holdings, sector allocations, and performance figures are based on J.P. Morgan data through June 30, 2026 and may change. This material is for informational purposes and is not individualized investment advice.