SCHD Dividend Growth Rate Explained With Historical Trends and 2026 Outlook for Investors
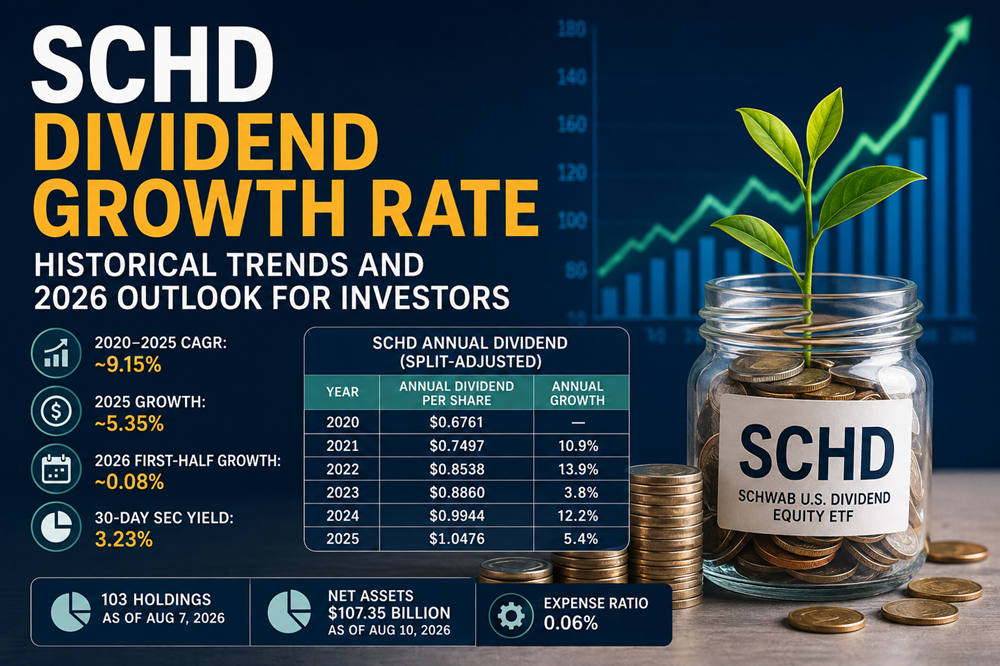
The SCHD dividend growth rate has been one of the ETF’s biggest attractions for income investors. From 2020 through 2025, SCHD’s split-adjusted annual distributions grew at roughly 9.15% per year, although growth slowed to about 5.35% in 2025. So far in 2026, the first two distributions are almost unchanged from the same period a year earlier.
That history is encouraging, but SCHD does not have a fixed dividend growth rate. Its dividend can grow quickly in some years, increase slowly in others, or potentially fall if dividend income from its underlying holdings declines.
What Is SCHD?
SCHD is the Schwab U.S. Dividend Equity ETF, an exchange-traded fund launched in October 2011. Its objective is to track the Dow Jones U.S. Dividend 100 Index as closely as possible before fees and expenses. Schwab currently lists a 0.06% total expense ratio for the fund.
Like other exchange-traded funds, SCHD gives investors access to a portfolio of securities through shares that trade on an exchange. The fund is passively managed and focuses on established U.S. dividend-paying companies rather than trying to select individual stocks based on a manager’s market forecasts.
SCHD is not simply a collection of the stocks with the highest dividend yields. The Dow Jones U.S. Dividend 100 Index methodology considers dividend history, yield, dividend growth and measures of financial strength when constructing the portfolio.
That approach is one reason SCHD is often considered by investors who want both current income and the possibility of higher dividend income over time.
What Is the SCHD Dividend Growth Rate?
There is no single percentage that permanently represents SCHD’s dividend growth rate.
You can measure dividend growth in several ways:
- Year-over-year dividend growth
- Three-year dividend growth
- Five-year compound annual growth
- Ten-year compound annual growth
- Changes in individual quarterly distributions
For long-term comparisons, an annual dividend CAGR is generally more useful than looking at one quarterly payment.
SCHD also completed a 3-for-1 share split effective October 10, 2024. Earlier dividends therefore need to be adjusted when they are compared with current per-share payments. The split itself did not create additional investment value; it changed the number of shares and the corresponding value per share.
Using Schwab’s published SCHD distribution information, the annual dividend history looks approximately like this after adjusting older payments for the split:
| Year | Annual Dividend Per Share | Annual Growth |
|---|---|---|
| 2020 | $0.6761 | — |
| 2021 | $0.7497 | 10.9% |
| 2022 | $0.8538 | 13.9% |
| 2023 | $0.8860 | 3.8% |
| 2024 | $0.9944 | 12.2% |
| 2025 | $1.0476 | 5.4% |
From 2020 through 2025, the split-adjusted annual distribution increased from approximately $0.6761 to $1.0476 per share. That works out to a compound annual dividend growth rate of about 9.15%.
The year-by-year numbers are just as important as the average. SCHD did not increase its dividend by roughly 9% every year. Growth ranged from around 3.8% in 2023 to almost 14% in 2022.
That variation is normal for a fund whose distributions ultimately depend on dividend payments from a changing portfolio of individual companies.
SCHD Dividend Growth in 2026
The early 2026 numbers show a much slower pace of growth.
SCHD paid approximately $0.2569 per share in March 2026 and $0.2525 in June 2026, producing a first-half total of about $0.5094. Schwab’s current fund information and 2026 distribution schedule provide the official distribution dates and fund information.
During the first half of 2025, SCHD’s comparable distributions totaled about $0.5090.
That means first-half distributions increased by only around 0.08% year over year.
However, 0.08% should not be described as SCHD’s full 2026 dividend growth rate. September and December distributions are still needed before the calendar-year total can be compared properly with 2025.
For now, the more accurate takeaway is that SCHD’s dividend growth has been essentially flat during the first half of 2026.
Two quarters do not establish a long-term trend, but the numbers do show why investors should be careful about assuming SCHD will reproduce its historical 9%+ dividend CAGR every year.
Why Has SCHD Historically Grown Its Dividend?
The design of SCHD’s underlying index helps explain its dividend-growth history.
According to the Dow Jones Dividend Indices methodology, companies considered for the Dow Jones U.S. Dividend 100 Index must pass screens related to dividend consistency, company size and trading liquidity.
A company generally needs at least 10 consecutive years of dividend payments, a float-adjusted market capitalization of at least $500 million and sufficient trading volume to pass the initial screens.
Companies passing those requirements are ranked by indicated annual dividend yield, with the higher-yielding half remaining eligible for further selection.
The methodology then evaluates four important measures:
- Free cash flow relative to total debt
- Return on equity
- Dividend yield
- Five-year dividend growth rate
These measures are combined into a composite ranking used to identify the index constituents. S&P Dow Jones Indices describes the approach as one designed to combine dividend income with measures related to quality and dividend sustainability.
The five-year dividend growth rate component is particularly important for SCHD investors. The portfolio is not simply hoping its companies will raise dividends in the future. Historical dividend growth is one of the factors considered when companies are ranked.
Free cash flow and return on equity add another layer. A strong dividend history is more useful when the company also has financial characteristics that may help it continue supporting those payments.
That does not prevent dividend cuts. Schwab specifically warns that stocks held by the fund can reduce or stop paying dividends, which can affect SCHD’s ability to generate income.
SCHD Dividend Growth Rate vs. Dividend Yield
Dividend growth rate and dividend yield are closely related to income investing, but they measure different things.
Dividend yield tells you how much income an investment is producing relative to its current value.
Dividend growth rate tells you how quickly the amount paid per share is changing.
As of August 7, 2026, Schwab reported an SCHD 30-day SEC yield of 3.23%. Its trailing distribution yield was 3.30% as of June 30, 2026.
Neither figure should be confused with SCHD’s approximately 9.15% calculated dividend CAGR from 2020 through 2025.
For example, a 3.3% dividend yield does not mean the dividend grows by 3.3% annually. Likewise, historical dividend growth of 9% does not mean an investor receives a 9% annual yield.
You can think of the two measurements this way:
- Yield measures income today.
- Dividend growth measures how that income changes.
Both can matter to a long-term income investor.
A relatively high starting yield provides more immediate income, while consistent dividend growth can potentially increase future income. Neither, however, guarantees a particular total investment return.
What Could SCHD’s Future Dividend Growth Rate Look Like?
SCHD’s historical numbers provide useful context, but they are not a reliable forecast by themselves.
The 2020–2025 dividend CAGR of approximately 9.15% included years with very different results. Growth exceeded 10% in several years, fell below 4% in 2023 and came in around 5.35% in 2025. The first half of 2026 has shown almost no year-over-year growth.
This makes automatically projecting 9% or 10% annual growth far into the future risky.
Future distributions will depend largely on dividend decisions made by the companies inside SCHD. Companies may raise their dividends when earnings and cash flow allow, keep payouts unchanged during uncertain periods, or reduce them when financial conditions deteriorate.
The portfolio itself can also change as the underlying index is reviewed and rebalanced. S&P Dow Jones Indices uses eligibility requirements, rankings and maintenance rules to determine which companies remain in the index.
Rather than relying on one growth assumption, investors planning future income can model several possibilities.
For example:
- A 3% dividend growth assumption represents a cautious scenario.
- A 5% growth assumption offers a moderate scenario.
- A 7% growth assumption represents stronger continued growth.
- A 9% assumption is closer to SCHD’s calculated 2020–2025 historical CAGR but should not be treated as guaranteed.
These are planning scenarios, not forecasts.
The important question is whether your investment strategy still makes sense if SCHD’s future dividend growth is lower than its historical average.
Is SCHD Good for Dividend Growth Investors?
SCHD has several characteristics that can appeal to dividend-growth investors.
Its low 0.06% expense ratio allows most of the fund’s investment return to remain with shareholders rather than being consumed by management expenses. The fund also currently offers a yield above 3%, while its index specifically incorporates dividend growth and fundamental-quality measures.
The distribution record has been strong over the period examined. SCHD’s split-adjusted annual dividend increased from about $0.6761 per share in 2020 to $1.0476 in 2025.
However, the recent slowdown is a useful reminder that dividend growth is not automatic.
Investors should also consider more than distributions alone. FINRA’s guidance on evaluating investment performance emphasizes looking at investment results in the context of goals, risk and appropriate comparisons rather than focusing on one number alone.
For SCHD, that means considering the current yield, dividend growth, total return, portfolio composition, expenses and your own investment horizon together.
The best way to interpret the SCHD dividend growth rate is therefore to look at multiple years rather than one quarterly payment. Historically, SCHD delivered roughly 9.15% annualized dividend growth from 2020 through 2025, while 2026 has started much more slowly.
Whether SCHD can return to stronger dividend growth will depend on the dividends generated by its underlying companies and how the portfolio evolves over time. Historical distributions can help you understand the fund’s track record, but they cannot guarantee what SCHD will pay next year.
Past distributions and investment performance do not guarantee future results.