iShares Russell 1000 Growth ETF Explained: Holdings, Performance, Fees, and Key Risks
The iShares Russell 1000 Growth ETF (IWF) gives you a simple way to invest in hundreds of large- and mid-sized U.S. companies with growth characteristics. Its portfolio is dominated by some of the biggest names in technology and communications, so it offers much more targeted exposure than a broad U.S. stock-market fund.
IWF has a low expense ratio, a long operating history, and more than $126 billion in assets. However, its heavy weighting toward technology and mega-cap growth stocks means it can also experience sharp swings when growth stocks fall out of favor.
What Is the iShares Russell 1000 Growth ETF?
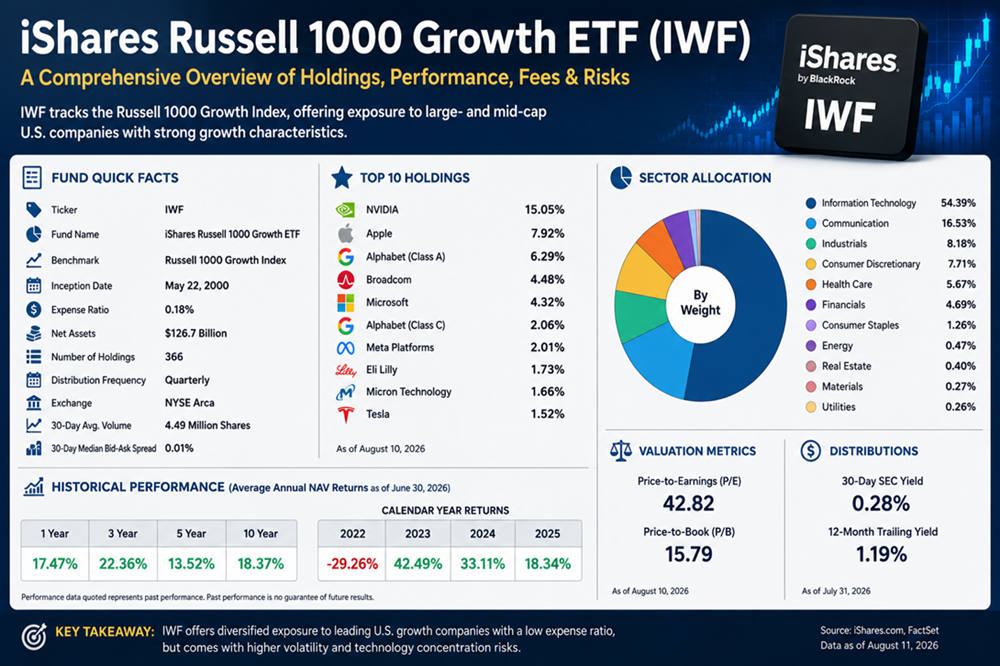
The iShares Russell 1000 Growth ETF trades under the ticker IWF and is managed by BlackRock Fund Advisors. It launched on May 22, 2000, and trades on NYSE Arca.
The fund seeks to track the Russell 1000 Growth Index, which includes large- and mid-cap U.S. stocks that display stronger growth characteristics than other companies in the broader Russell 1000 universe.
As of August 11, 2026, IWF had approximately $126.7 billion in net assets. It held 366 securities as of August 10, 2026.
| IWF Quick Fact | Information |
|---|---|
| Ticker | IWF |
| Fund name | iShares Russell 1000 Growth ETF |
| Asset class | U.S. equities |
| Benchmark | Russell 1000 Growth Index |
| Inception date | May 22, 2000 |
| Expense ratio | 0.18% |
| Number of holdings | 366 |
| Net assets | About $126.7 billion |
| Distribution frequency | Quarterly |
| Exchange | NYSE Arca |
IWF is best viewed as a U.S. growth-stock ETF, not as a complete substitute for the entire U.S. stock market.
How the Russell 1000 Growth Index Works
The Russell 1000 Growth Index starts with companies in the broader Russell 1000 universe and evaluates their growth and value characteristics.
The FTSE Russell style methodology considers factors including:
- Book-to-price ratio
- Forecast medium-term earnings growth
- Five-year historical sales-per-share growth
Companies with stronger growth characteristics receive greater representation in the growth index. A company does not always have to be classified entirely as growth or entirely as value. In some cases, its market capitalization can be split between both style indexes.
That detail is important because “growth stock” is not simply another term for a company whose sales are increasing quickly. Expected earnings growth and valuation characteristics also help determine where a stock fits.
Russell indexes undergo regular maintenance to keep their membership and style classifications aligned with the market. The broader Russell U.S. Equity Index methodology explains how constituents, style assignments, and index maintenance are handled.
The IWF underlying index also uses quarterly rebalancing and company-weight caps, as described in the fund’s SEC summary prospectus.
IWF seeks to follow that index rather than trying to pick stocks that BlackRock believes will outperform.
IWF Holdings and Sector Exposure
IWF owns hundreds of stocks, but its largest positions have a major influence on overall performance.
As of August 10, 2026, the largest holdings included:
- NVIDIA
- Apple
- Alphabet
- Broadcom
- Microsoft
- Meta Platforms
- Eli Lilly
- Micron Technology
- Tesla
NVIDIA alone represented roughly 15% of the fund, making the performance of the largest companies particularly important to IWF’s returns. You can check the latest weights on the official IWF holdings page.
The sector breakdown shows an even clearer growth tilt.
| Sector | Approximate Weight |
|---|---|
| Information Technology | 54.39% |
| Communication | 16.53% |
| Industrials | 8.18% |
| Consumer Discretionary | 7.71% |
| Health Care | 5.67% |
| Financials | 4.69% |
| Consumer Staples | 1.26% |
| Energy | 0.47% |
| Real Estate | 0.40% |
| Materials | 0.27% |
| Utilities | 0.26% |
The key takeaway is that IWF is diversified across many individual companies, but not equally diversified across sectors. Technology accounts for more than half of the portfolio.
That can work well when large technology companies are leading the market, but it also means weakness in that sector can have a noticeable effect on the fund.
IWF Historical Performance
IWF has delivered strong long-term returns, particularly during periods when large U.S. growth stocks have led the market.
According to the fund’s official performance data, average annual NAV returns through June 30, 2026, were:
| Period | Average Annual Return |
|---|---|
| 1 year | 17.47% |
| 3 years | 22.36% |
| 5 years | 13.52% |
| 10 years | 18.37% |
These returns were close to those of the Russell 1000 Growth Index, which is what you would expect from a passive ETF designed to follow that benchmark.
The longer-term averages do not mean returns arrive steadily each year.
IWF fell 29.26% in 2022, before gaining 42.49% in 2023, 33.11% in 2024, and 18.34% in 2025.
Those large changes show why a growth ETF can require patience. Even a portfolio filled with profitable, well-known companies can experience substantial declines when valuations fall or investors move away from growth stocks.
Past performance does not guarantee future results.
IWF Expense Ratio and Dividends
IWF has an expense ratio of 0.18%. The current fee and other fund costs are detailed in the IWF prospectus filed with the SEC.
That works out to roughly $18 per year for every $10,000 invested, assuming the investment value remained unchanged for purposes of the simple example.
ETF investors can also face normal trading costs, including bid-ask spreads and any brokerage charges imposed by their platform.
Does IWF Pay Dividends?
Yes. IWF makes distributions quarterly, although dividend income is not the main purpose of the fund.
As of July 31, 2026, its 30-day SEC yield was 0.28%, while its 12-month trailing yield was 1.19%. Yields change over time and should not be treated as guaranteed income.
If generating regular dividend income is your main goal, IWF is not specifically designed for that purpose. Its portfolio is built primarily around growth stocks.
Advantages of IWF
IWF has several practical features that can make it useful for investors who specifically want a growth allocation.
Broad Growth Exposure in One Fund
Instead of choosing a few individual growth stocks, IWF spreads your investment across hundreds of companies.
That reduces the impact that trouble at one smaller holding could have on your portfolio, although the largest positions still carry significant weight.
Low Ongoing Fund Cost
The 0.18% expense ratio provides diversified growth exposure without the higher management fees often associated with actively managed funds.
Fund expenses matter over long investing periods because even relatively small annual costs reduce the amount of money that remains invested.
Established Trading History
IWF has operated since 2000. Its history covers several very different market environments, including the dot-com downturn, the 2008 financial crisis, the pandemic-era market shock, and the major growth-stock decline of 2022.
That history does not reduce investment risk, but it gives you a longer record to examine than you would get from a newly launched ETF.
Strong Liquidity
IWF is actively traded. Its 30-day average daily volume was approximately 4.49 million shares as of August 10, 2026, and its reported 30-day median bid-ask spread was 0.01%.
For ordinary investors, a heavily traded ETF with a narrow spread can generally be easier to enter and exit than a thinly traded fund.
Risks to Consider Before Investing in IWF
The biggest risks come directly from the type of stocks IWF is designed to own.
Technology Concentration
With information technology making up more than half of the portfolio, IWF’s performance depends heavily on that sector.
Owning 366 securities may sound broadly diversified, but the sector breakdown matters just as much as the number of holdings.
Large Mega-Cap Positions
A handful of very large companies represent a meaningful portion of the fund.
This becomes especially important if you already own an S&P 500 fund, Nasdaq-focused ETF, or technology ETF. Those investments may contain many of the same companies, giving your overall portfolio more mega-cap growth exposure than you intended.
Growth-Stock Valuations
IWF had a portfolio price-to-earnings ratio of 42.82 and a price-to-book ratio of 15.79 as of August 10, 2026.
A high P/E ratio does not automatically mean the ETF is overpriced or that its holdings will fall. It does show that investors are paying a substantial price for expected future earnings.
If those companies grow more slowly than investors expect, their valuations can fall even if the businesses remain profitable.
Growth Stocks Can Fall Quickly
Growth shares can respond sharply to weaker earnings forecasts, changes in investor expectations, slowing economic conditions, or rising required rates of return.
The fund’s SEC prospectus specifically discusses growth securities risk and explains that growth stocks can underperform other investment styles for extended periods.
This is why IWF’s long-term return should be considered alongside its potential for large short-term losses.
Who Might IWF Suit?
IWF may make sense for an investor who intentionally wants to increase exposure to U.S. growth stocks.
It may be worth considering if you want:
- Large- and mid-cap U.S. growth exposure
- One ETF instead of selecting individual growth companies
- A passive investment strategy
- A relatively low expense ratio
- Significant exposure to large technology companies
- A long-term investment rather than short-term income
IWF may be less suitable if your priority is:
- High dividend income
- Balanced exposure across all U.S. sectors
- Strong value-stock exposure
- International diversification
- Lower dependence on technology companies
- Avoiding large growth-stock price swings
Your existing investments matter as well. Someone who already owns a broad U.S. market fund could use IWF to deliberately increase the growth portion of a portfolio. Someone using IWF as their only stock fund would have a much stronger growth and technology bias.
The Bottom Line
The iShares Russell 1000 Growth ETF offers a straightforward way to invest in a broad group of large- and mid-cap U.S. growth companies. Its 0.18% expense ratio, established history, and hundreds of holdings make it a practical growth ETF, while its heavy technology exposure and large mega-cap positions give it a much different risk profile from a total-market fund.
The most important question is not whether IWF is universally a good or bad investment. It is whether its concentrated growth exposure fits the role you want it to play in your overall portfolio.